Recurring manual exports
Reports depend on someone copying data between spreadsheets, connectors and slides.
FOR PERFORMANCE, PPC & SEO AGENCIES
We build the BigQuery layer behind your client reports — connecting ad platforms, website data and CRM. Scheduled, checked and documented.
Your Google Cloud. Your client relationships.
White-label delivery by agreement.
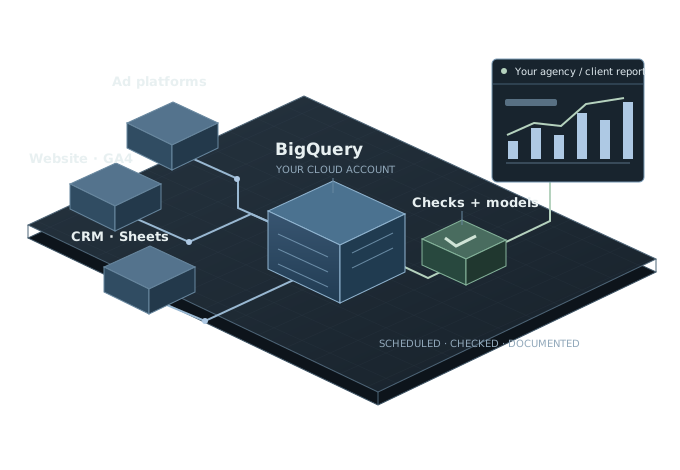
WHEN TO BRING US IN
Reports depend on someone copying data between spreadsheets, connectors and slides.
Your client asks what became revenue. The numbers stop at clicks and leads.
A disconnected source or partial load can quietly turn yesterday’s numbers into today’s problem.
SOLUTIONS & SELECTED WORK
From the first conversion event to the client report. The work underneath, with evidence you can inspect.
CLIENT REPORTING AUTOMATION
Move recurring exports into scheduled pipelines. Keep the reporting interface your team already uses.
Google Ads and Keyword Planner data moved into BigQuery, with Google Sheets kept as the working interface.
The client estimated the previous manual process took about a week each month. This is a client estimate, not a measured savings study.Simplified architecture · illustrative table, no client data
MARKETING + CRM REPORTING
Bring campaign costs, enquiries and CRM outcomes into one reporting layer, with clear metric definitions.
Website tracking, advertising sources and CRM outcomes brought into BigQuery and Looker Studio.
Delivered: tracking, API ingestion, SQL reporting tables and dashboards. Revenue improvement was not measured.One reporting layer · spend · leads · deals
CONVERSION TRACKING
Fix the measurement layer when a checkout, another domain or a missing event breaks the customer journey.
Purchase and conversion tracking across three domains and 13 advertising and affiliate platforms.
Maintained across a second contract; 5.0 client rating. Platform coverage is not a claim of sales uplift.Cross-domain measurement · GA4 / GTM / ad platforms
Recognise a workflow in your agency?
Tell us what needs fixingDATA QUALITY, MADE VISIBLE
Check a new dataset before replacing the reporting tables. If it fails, hold the update and make the delay visible.
The API returns only part of the expected dataset.
Partial loadCompleteness and source-count checks fail. The release is held.
Update held · alert raisedRefresh delayed · showing the previous verified release
The report stays readable. Its freshness warning stays visible.Hold the incomplete release. Alert the engineer. Show when the data was last verified.
A documented reliability project used 30 dbt tests, source-count reconciliation and a separate release before switching reporting tables.
The project used a different warehouse stack. This BigQuery-oriented example illustrates the pattern; it is not a reproduction of that system or a live uptime claim.HOW WE WORK
A defined first step, a scoped build and a clear handover. Ongoing support can follow once the foundation is in place.
Review one reporting flow: sources, discrepancies, connector costs and manual work.
Connect the sources, prepare reporting tables and add checks for the agreed workflow.
Document the sources, metric definitions, refresh schedule and recovery steps.
ABOUT OMDIGITAL
OMDigital is a marketing data engineering company. We connect tracking, pipelines and reporting for agencies whose client work has outgrown spreadsheets and fragile connectors.
Our work starts with the question your client needs answered, then follows the data back to the source.

FOUNDER & LEAD ENGINEER
A background in web analytics, conversion tracking and data engineering — from the event on the website to the number in the report.
View LinkedIn Projects & client reviews
WEBSITES & UX
Builds websites, connects customer interactions and improves the user experience.

AI ASSISTANTS & AUTOMATION
Builds AI assistants, chatbots and automated customer journeys with n8n and JavaScript.

REPORTING & BEHAVIOURAL ANALYTICS
Creates analytical reports and examines website behaviour to identify friction in the user experience.
A FEW PRACTICAL DETAILS
White-label delivery is available by agreement. We define who communicates with your client, how work is presented and the access needed before starting.
Not necessarily. We can keep the reporting interface and improve the data behind it. The Google Ads project above kept Google Sheets as the team’s working interface.
For new builds, the data foundation lives in your or your client’s Google Cloud account. Code, documentation, access and handover are included in the agreed project scope.
Yes. If your team has outgrown spreadsheets or needs ad, website and CRM data brought together, the same reporting foundation can fit. Start by describing one workflow.
We agree access requirements, confidentiality terms, the project contact and update cadence before work begins. Share an outline first; account credentials are not needed for the initial conversation.
LET’S LOOK AT YOUR WORKFLOW
Tell us what you use, what breaks and what you want to change. We’ll use that to discuss a sensible first step.
A little context and an email address so we can reply.
PREFER TO TALK?
A 30-minute introductory call to understand the current setup and whether we’re a fit.
The calendar loads only when you open it.
A quick outline is enough. The paid workflow review starts from $500 if that is the right next step.
If the calendar does not load, open Cal.com in a new tab .